Turn Training into Measurable Performance
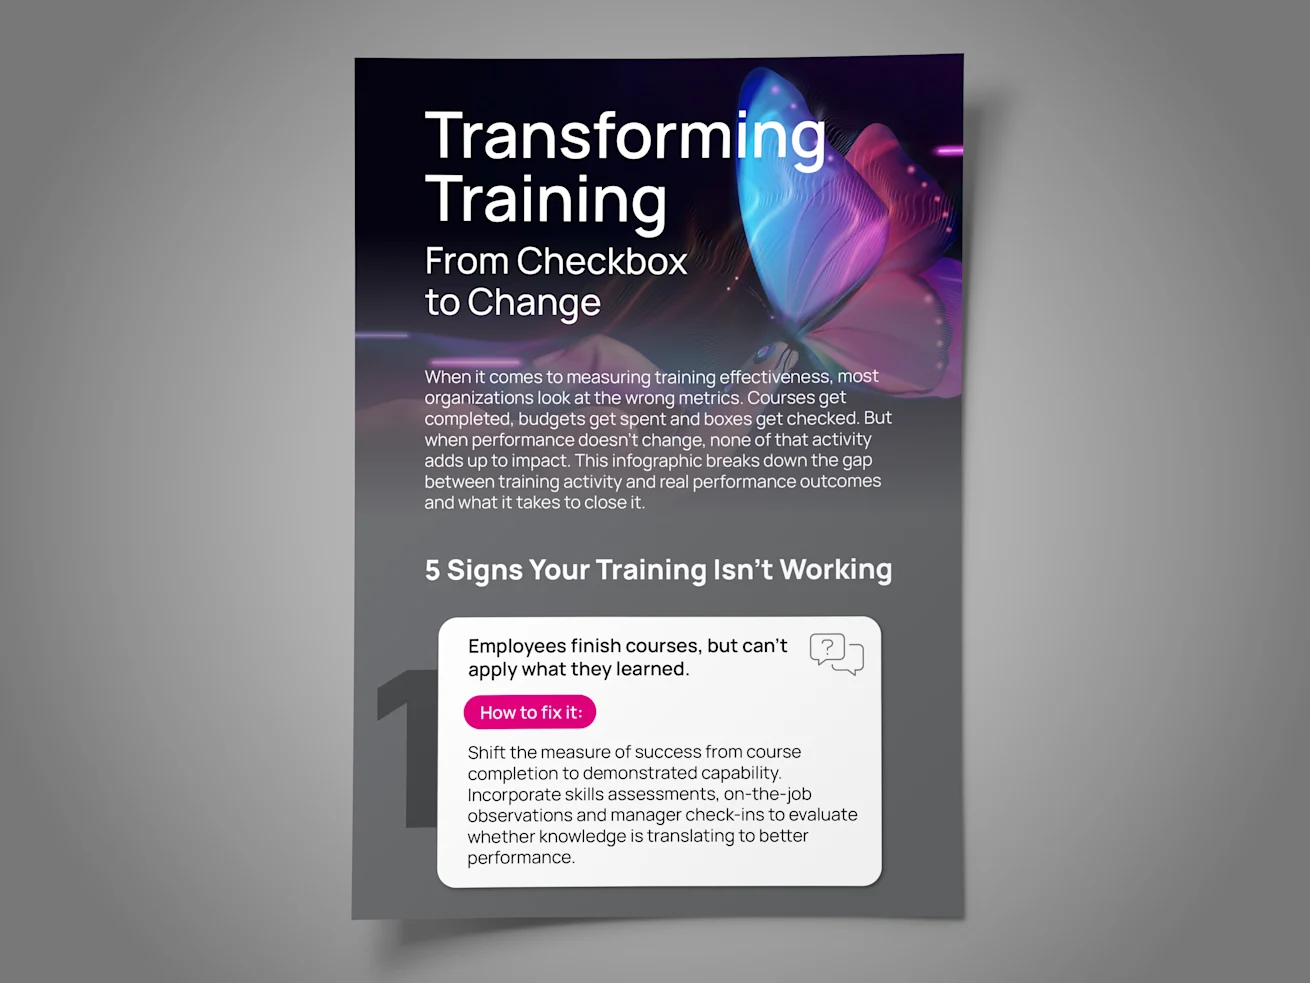
Course completion rates don’t always prove business impact. Employee training can look successful on paper while job performance stays the same. Whether you use a learning management system (LMS) or still track training in spreadsheets, this infographic helps you evaluate training effectiveness and see where your training programs fall short.
What the Infographic Covers
Completion rates versus capability, including knowledge retention and learning transfer
Training evaluation methods, including quizzes, knowledge checks, post-training surveys and focus groups
Links to business outcomes, from KPIs and customer satisfaction to employee performance
Skill gaps and visibility, including learning analytics and progress tracking
Reinforcement after training, including behavior change and on-the-job application
Measuring training ROI, including the return on your training investment
Download the infographic to see whether your training is improving performance and how isolved can help you track learning beyond completion and align employee development with business goals.
Please download your Infographic.
Download InfographicRelated Content

Labor Cost Management: Find Where Your Budget Is Leaking
Discover labor cost management gaps hiding in overtime, staffing levels, and manual timesheets. See what it takes to start controlling costs before margins shrink.
Read More
Infographic: HR Capacity Stress Test
When HR is stuck in admin, strategy stalls. Use this infographic to see where your team's time goes, spot capacity gaps and find ways to build capacity without new hires.
Read More
HR Department of One: The Full Scope of Running HR Solo
Discover what an HR department of one actually manages every day. Recruiting, compliance, payroll, benefits, leave, and reporting all fall on one person's plate.
Read More